Image Details
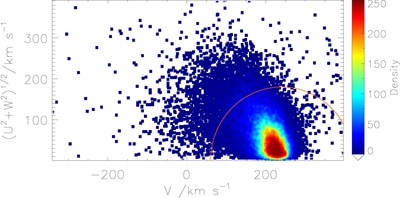
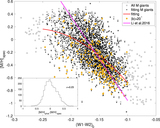
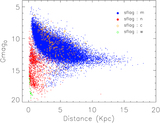
Caption: Figure 9.
Toomre density diagram of confirmed M giants. The red line kinematically divides the M giants sample into halo and disk components, since stars with ∣V–VLSR∣ > 180 km s−1 have higher probabilities of being members of the Galactic halo.
Other Images in This Article

Copyright and Terms & Conditions
© 2019. The American Astronomical Society. All rights reserved.
Copyright ©
2026 Astronomy Image Explorer. All Rights Reserved.