Image Details
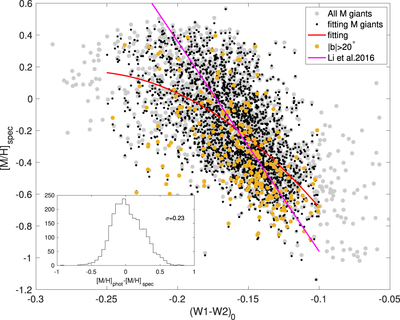
Caption: Figure 7.
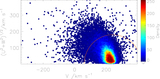
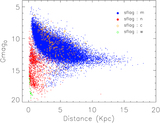
Metallicity distribution of APOGEE M giants vs. (W1 − W2)0 color. The red line shows the best-fit polynomial relationship. The inset histogram shows the scatter in metallicity about this relation, which has a dispersion of 0.23 dex.
Other Images in This Article

Copyright and Terms & Conditions
© 2019. The American Astronomical Society. All rights reserved.
Copyright ©
2026 Astronomy Image Explorer. All Rights Reserved.