Image Details
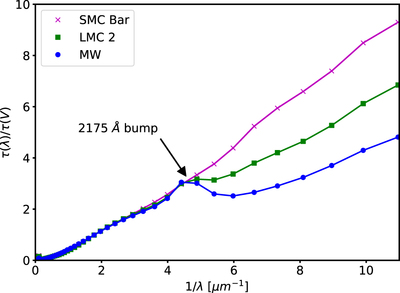
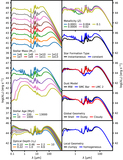
Caption: Figure 4.
DIRTYGrid extinction curves for the MW, LMC 2, and SMC Bar dust models are shown. The primary differences between these curves are the strength of the 2175 Å bump and the far-UV rise. Our choice of dust types is intended to cover the range of dust properties observed in galaxies.
Other Images in This Article

Copyright and Terms & Conditions
© 2018. The American Astronomical Society. All rights reserved.
Copyright ©
2025 Astronomy Image Explorer. All Rights Reserved.