

Image Details
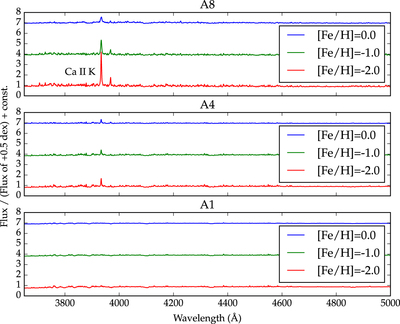
Caption: Figure 2.
Model stellar spectra of different metallicities divided by the corresponding model spectrum at [Fe/H] = 0.5 for different spectral subtypes (Allard et al. 2012). The Ca II K line shows the largest dependence on metallicity for A stars. For the A8 (top) and A4 (middle) stars, there are significant changes between the metallicity bins. While the A1 (bottom) spectrum does show changes in Ca II K line depth, they are not significant enough changes for us to confidently separate out metallicity bins based on the equivalent width of the Ca II K line.
Other Images in This Article
Show More
Copyright and Terms & Conditions
© 2017. The American Astronomical Society. All rights reserved.

Copyright ©
2026 Astronomy Image Explorer. All Rights Reserved.
