

Image Details
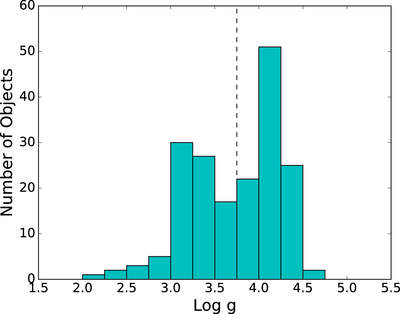
Caption: Figure 1.
Log g distribution of all the stars selected (and spectral typed) as A stars. There are two distinct populations: one centered around log g = 3.2 and one around log g = 4.0. The population with lower surface gravity is consistent with BHB giants, while the higher surface gravity population is composed of main-sequence stars and/or blue stragglers. The dashed line at log g = 3.8 marks the distinction between main-sequence stars (to the right of the line) and BHB giants (to the left of the line).
Other Images in This Article
Show More
Copyright and Terms & Conditions
© 2017. The American Astronomical Society. All rights reserved.

Copyright ©
2026 Astronomy Image Explorer. All Rights Reserved.
