

Image Details
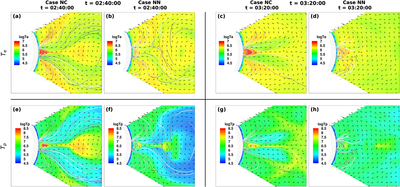
Caption: Figure 3.
Temperature comparison between Cases NC and NN. (a),(b) Electron temperature distribution in the Y = 0 plane of Cases NC and NN at t = 02: 40: 00. (c),(d) Similar to panels (a) and (b) but at t = 03: 20: 00. The second row is similar to the first row, but for the proton temperature distribution. The black arrows indicate the direction of the tangential magnetic field vector in the Y = 0 plane. The magnetic field lines are given in each panel for reference.
Other Images in This Article
Copyright and Terms & Conditions
© 2026. The Author(s). Published by the American Astronomical Society.

Copyright ©
2026 Astronomy Image Explorer. All Rights Reserved.
