

Image Details
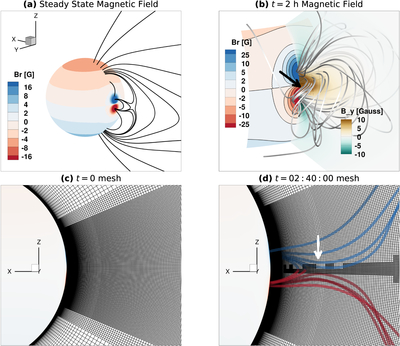
Caption: Figure 1.
Simulation setup. (a) Magnetic field of the steady-state background. (b) Magnetic field lines and By distribution in the Y = 0 plane after the STITCH driving phase in Case N. The black arrow labels a sheared arcade produced by the driving. (c),(d) Grid mesh in the Y = 0 plane at t = 0 s and t = 9600 s, respectively. The color indicates the local sign of Br (blue for positive and red for negative) in magnetic field lines.
Other Images in This Article
Copyright and Terms & Conditions
© 2026. The Author(s). Published by the American Astronomical Society.

Copyright ©
2026 Astronomy Image Explorer. All Rights Reserved.
