

Image Details
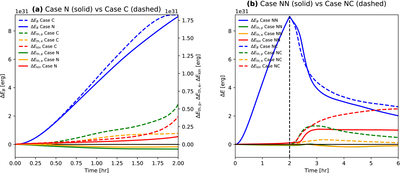
Caption: Figure 2.
Comparing the energy evolution of simulations using conservative and nonconservative schemes. The blue, red, green, and orange curves represent ΔEB, ΔEkin, ΔEth,p, and ΔEth,e. All energy terms are integrated over the entire simulation volume and are shown after subtracting their initial values. We use solid (nonconservative) and dashed (conservative) curves to distinguish between schemes. (a) Case C versus Case N. (b) Case NC versus Case NN.
Other Images in This Article
Copyright and Terms & Conditions
© 2026. The Author(s). Published by the American Astronomical Society.

Copyright ©
2026 Astronomy Image Explorer. All Rights Reserved.
