

Image Details
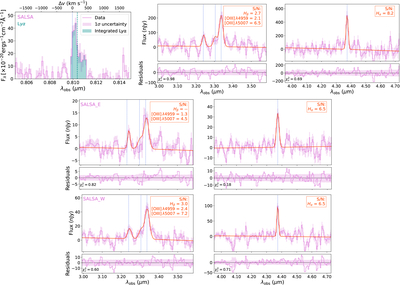
Caption: Figure 3.
Spectral extraction from SALSA (top) and the identified clumps SALSA_E (middle) and SALSA_W (bottom). The purple lines and shaded regions indicate the observed flux and 1σ uncertainties. The Lyα spectrum of SALSA from MUSE is extracted from the same region as the Hα emission in NIRSpec, with the integrated flux shown in the shaded cyan region. The red lines show the Gaussian fits describing the emission lines centered at the blue dotted lines, as explained in Section 4.1. S/Ns for the emission lines correspond to their empirical local detection significance and are quoted left to right as they appear in the spectrum.
Other Images in This Article
Copyright and Terms & Conditions
© 2026. The Author(s). Published by the American Astronomical Society.

