

Image Details
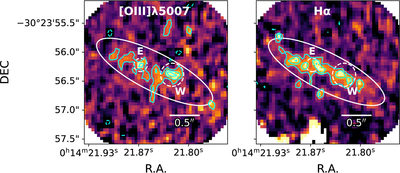
Caption: Figure 2.
Maps of the [O III] λ5007 (left) and Hα (right) surface brightness. The maps are constructed after subtracting a local baseline estimated from adjacent line-free channels. Pixels with unreliable noise estimates are masked prior to plotting. The white ellipse indicates the aperture used to extract the 1D spectrum, while the dashed circles SALSA_E and SALSA_W represent the clumps with the highest S/N. Cyan contours are shown at −3σ, 3σ, 5σ, and 7σ levels.
Other Images in This Article
Copyright and Terms & Conditions
© 2026. The Author(s). Published by the American Astronomical Society.

Copyright ©
2026 Astronomy Image Explorer. All Rights Reserved.
