

Image Details
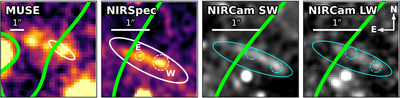
Caption: Figure 1.
Spatial morphology of SALSA and its position relative to the lensing critical line. From left to right, we show the 3σ Lyα emission from VLT/MUSE, the JWST/NIRSpec IFU map combining [O III] λ5007 and Hα, and JWST/NIRCam imaging in the short- and long-wavelength bands. The white ellipse in the MUSE and NIRSpec panels denotes the spectral extraction region for nebular emission analysis, while the dashed circles mark the eastern and western (SALSA_E, SALSA_W) compact emission components identified in the NIRSpec data. The NIRCam panels show the continuum emission in stacked images using the short- and long-wavelength bands, and the photometry is extracted within the corresponding cyan regions. The green curve indicates the critical line from the lens model at z = 5.66.
Other Images in This Article
Copyright and Terms & Conditions
© 2026. The Author(s). Published by the American Astronomical Society.

