

Image Details
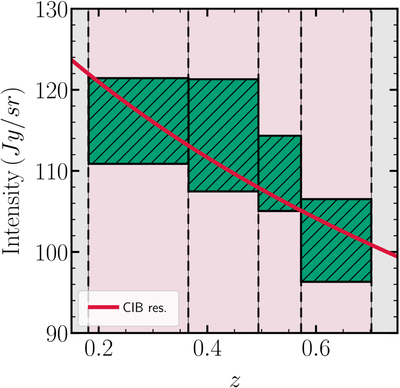
Caption: Figure A2.
Mean intensities of stacked eBOSS galaxies overlaid onto Planck’s CO(1–0) map. The boxes represent intensity variations, with box length indicating intensity uncertainty, and box width depicting the range of redshift bins. Additionally, the figure displays the best-fit power-law model for the residual foreground, aligning with the measured intensities.
Other Images in This Article
Copyright and Terms & Conditions
© 2026. The Author(s). Published by the American Astronomical Society.

Copyright ©
2026 Astronomy Image Explorer. All Rights Reserved.
