

Image Details
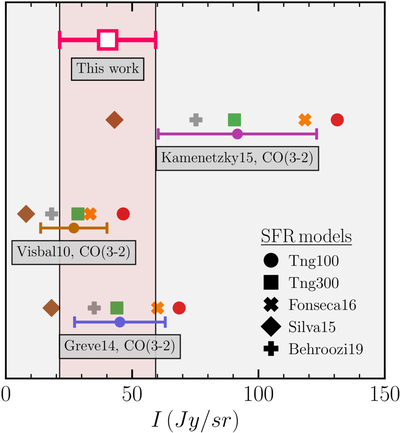
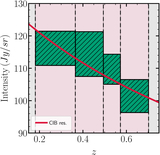
Caption: Figure 4.
Various CO(3–2) model predictions are compared with the measured CO(3–2) intensity at z ∼ 0.5. The legend provides descriptions of the SFR models, while annotations within the gray boxes denote the models that convert SFR to CO(3–2) line luminosities. The horizontal bar for a particular line luminosity model is calculated from the variance in intensities for the different SFR models.
Other Images in This Article
Copyright and Terms & Conditions
© 2026. The Author(s). Published by the American Astronomical Society.

Copyright ©
2026 Astronomy Image Explorer. All Rights Reserved.
