

Image Details
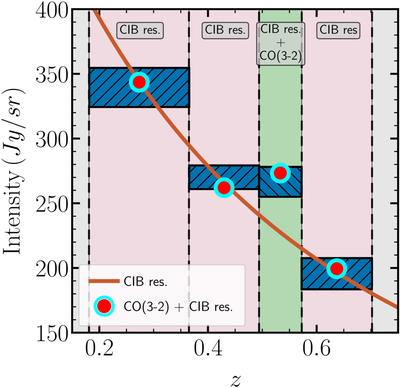
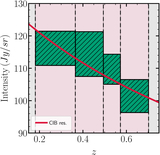
Caption: Figure 2.
We display the estimated intensities along with their respective errors with boxes at four redshift bins. The red line is an empirical redshift trend of the correlated continuum residual. The shaded green region indicates the redshift range where we anticipate contributions from CO(3–2), while the other bins can contain correlated continuum.
Other Images in This Article
Copyright and Terms & Conditions
© 2026. The Author(s). Published by the American Astronomical Society.

Copyright ©
2026 Astronomy Image Explorer. All Rights Reserved.
