

Image Details
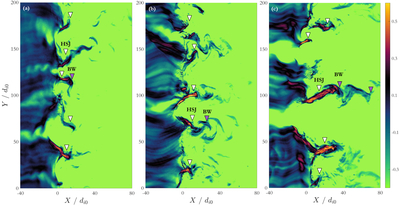
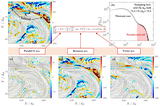
Caption: Figure 5.
Effect of the ion-to-electron mass ratio on simulated HSJs. Panels (a)–(c) show simulations with mass ratios mi/me = 100, 400, and 1200, respectively. The white and purple arrowheads mark HSJs and BWs, respectively. The color scale shows ﹩{\mathrm{log}}_{10}({P}_{d}/{P}_{d0})﹩. The shock fronts are shifted to X = 0 for comparison.
Other Images in This Article
Copyright and Terms & Conditions
© 2026. The Author(s). Published by the American Astronomical Society.

Copyright ©
2026 Astronomy Image Explorer. All Rights Reserved.
