

Image Details
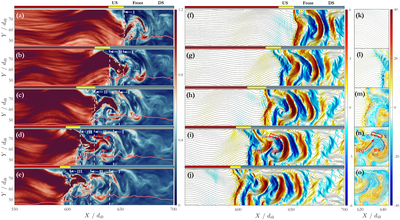
Caption: Figure 2.
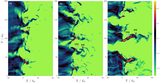
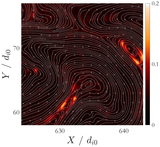
ULF-wave compression and HSJ formation at a parallel shock. Panels (a)–(e) show the time evolution of the ion dynamic pressure Pd/Pd0 at t = 40.2, 44.2, 48.2, 52.9, and ﹩56\,{{\rm{\Omega }}}_{ci0}^{-1}﹩, respectively. In each panel, the red, yellow, and blue horizontal bars at the top mark the upstream (US), shock-front (Front), and downstream (DS) regions at the corresponding time. The white curve with a red outline shows the ion number density Ni/N0 averaged over Y = 65–75di0. The white vertical dashed line denotes the overshoot position of the shock front. The shock front can undergo self reformation; labels I, II, and III indicate the old and new shock overshoots during the self-reformation cycles. Panels (f)–(j) show the corresponding profiles of the magnetic field component By/B0. Panels (k)–(o) represent the current sheets at the leading edge of the HSJs downstream of the shock. Magnetic field lines are also shown as black curves for reference.
Other Images in This Article
Copyright and Terms & Conditions
© 2026. The Author(s). Published by the American Astronomical Society.

