

Image Details
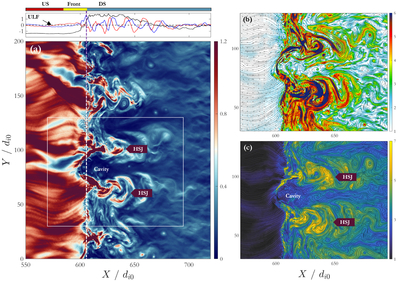
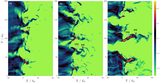
Caption: Figure 1.
Overview of HSJs at a parallel shock. (a) Ion dynamic pressure Pd/Pd0 at ﹩t=54\,{{\rm{\Omega }}}_{ci0}^{-1}﹩. Warm colors highlight HSJs, and cool colors mark cavities. The Y-averaged By (red), Bz (blue), and shifted B (black) are shown above panel (a). Horizontal bars mark the upstream (US), shock-front (Front), and downstream (DS) regions from left to right. The vertical dashed line indicates the location of the shock front. Panels (b) and (c) show enlarged views of the white box in panel (a), with B/B0 and N/N0, respectively. Magnetic field lines are shown as black curves for reference.
Other Images in This Article
Copyright and Terms & Conditions
© 2026. The Author(s). Published by the American Astronomical Society.

Copyright ©
2026 Astronomy Image Explorer. All Rights Reserved.
