

Image Details
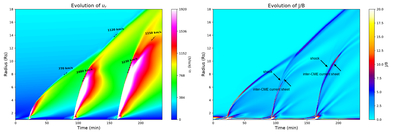
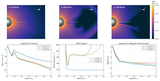
Caption: Figure 3.
Time–distance maps of vr and J/B along the eruption path indicated by the dashed line in Figure 2(b). In the vr map, the typical speeds are denoted by the dashed lines and numbers. In the J/B map, the location of shocks and inter-CME current sheets are marked by the arrows.
Other Images in This Article
Copyright and Terms & Conditions
© 2026. The Author(s). Published by the American Astronomical Society.

Copyright ©
2026 Astronomy Image Explorer. All Rights Reserved.
