

Image Details
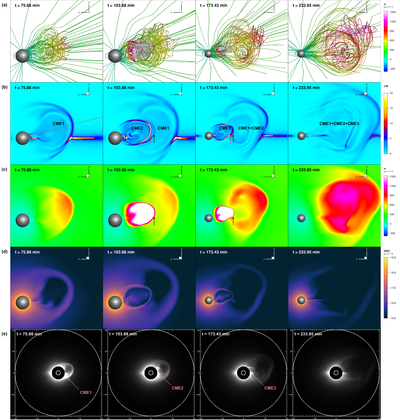
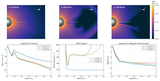
Caption: Figure 2.
Global evolution toward compound ejecta and synthetic coronagraph signatures. (a)–(d) Snapshots at four selected times, illustrating the formation and interaction of three CMEs, (a) displaying 3D magnetic-field lines color-coded by radial velocity, (b) with the normalized current density J/B on the central meridional plane, (c) with the radial velocity, and (d) with the logarithmic density. The sphere represents the solar surface. The dashed line in panel (b) marks the sampling path for the time–distance analysis in Figure 3. The two arrows in the second frame (i.e., t = 103.9 minutes) of panel (b) mark the MFR front (red arrow) and the CME-driven shock (black arrow), respectively. In panel (c), the black arrow is also shown denoting the same location in the velocity profile. The arrows in the third frame (t = 173.4 minutes) have the same meanings as those in the second frame, but for CME3. (e) Synthetic polarized-brightness images at four selected times, with a field of view of 20R⊙ centered on the Sun and an inner occulter at 3R⊙. The line of sight is defined along the y-axis. The inner circle is the solar surface and the outer circle is 20R⊙. An animation of panels (a)–(d) is available. It displays the evolution the entire simulation period from t = 0 to t = 233 minutes with a cadence of 0.45 minutes. The real-time duration of the animation is 52 s.
(An animation of this figure is available in the online article.)
(An animation of this figure is available.)
The video/animation of this figure is available in the online journal.
Other Images in This Article
Copyright and Terms & Conditions
© 2026. The Author(s). Published by the American Astronomical Society.

