

Image Details
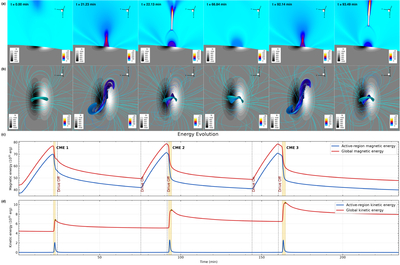
Caption: Figure 1.
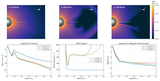
Evolution of energies and source-region topology during three homologous eruptions. Panels (a) and (b) show the repeated arcade–sigmoid–arcade transition, with (a) displaying the normalized current density J/B on a vertical slice and (b) showing sampled 3D field lines above the photospheric Br distribution. Panels (c) and (d) present the magnetic and kinetic-energy evolution for the global and AR volumes, respectively. Vertical dashed lines mark each energizing episode; yellow shading indicates the impulsive acceleration phase of each CME. An animation of this figure is available. It displays the evolution of panels (a) and (b) over the entire simulation period from t = 0 to t = 233 minutes with a cadence of 0.45 minutes. The real-time duration of the animation is 52 s.
(An animation of this figure is available in the online article.)
(An animation of this figure is available.)
The video/animation of this figure is available in the online journal.
Other Images in This Article
Copyright and Terms & Conditions
© 2026. The Author(s). Published by the American Astronomical Society.

