

Image Details
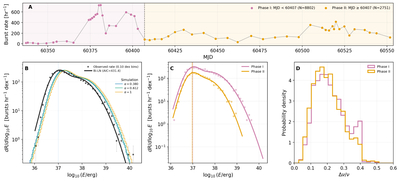
Caption: Figure 4.
Energy function and fractional-bandwidth (Δν/ν) statistics of FRB 20240114A based on FAST observations. Panel (A): burst-rate evolution divided at MJD 60407 into Phase I (pink) and Phase II (orange). Phase I contains the major high-rate burst episode, while Phase II provides a lower-rate reference interval. Panel (B): energy function of all FAST bursts shown in panel (A). The black points show the observed energy function, and the black solid curve shows the empirical bi-lognormal fit. The colored curves show simulated energy functions after plasma-lens magnification for α = 0.380, 0.612, and 1, starting from the intrinsic energy distribution. In these simulations, magnification shifts the turnover of the energy function toward higher energies. Simulation details are given in the Appendix. Here, the one-dimensional Gaussian lens model is used only as an illustrative example. More generally, if plasma lensing magnifies the observed bursts, their apparent energies will be shifted accordingly, modifying the observed energy distribution. Therefore, a change in the characteristic energy scale is a generic consequence of lensing magnification and does not depend on the specific lens model adopted here. Panel (C): observed energy functions in Phases I and II. Although Phase I has a higher normalization because of its enhanced burst rate, no comparable shift of the turnover toward higher energies is apparent. Panel (D): fractional-bandwidth distributions for the same two phases. The distributions largely overlap, with no clear systematic shift or narrowing during the high-rate interval.
Other Images in This Article
Copyright and Terms & Conditions
© 2026. The Author(s). Published by the American Astronomical Society.

