

Image Details
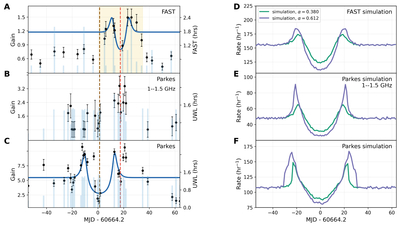
Caption: Figure 3.
Plasma-lensing fits and simulations for the burst-rate modulation of FRB 20240114A. Panels (A)–(C) show the observational results over the same time interval. Panel (A) presents the FAST burst-rate variation together with the one-dimensional Gaussian plasma-lensing fit. Panel (B) shows the Parkes UWL observations using only bursts with central frequencies between 1.0 and 1.5 GHz, while panel (C) shows the full-band Parkes UWL results together with the corresponding plasma-lensing fit. Panels (D)–(F) show the simulated burst-rate variations for FAST, Parkes 1.0–1.5 GHz, and the full Parkes UWL band, respectively, assuming a one-dimensional Gaussian plasma lens with lens strengths α = 0.380 and 0.612. If the burst-rate variations observed by FAST and Parkes over the same time interval were produced by the same plasma lens, the expected behavior would resemble the simulations; although the observing frequencies differ, the centers of the lensing-induced attenuation troughs remain aligned in time.
Other Images in This Article
Copyright and Terms & Conditions
© 2026. The Author(s). Published by the American Astronomical Society.

