

Image Details
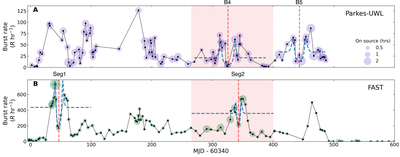
Caption: Figure 1.
The burst-rate evolution of FRB 20240114A, observed with Parkes and FAST. Panel (A) shows the burst rate measured with Parkes, where the marker size represents the on-source time (data taken from P. A. Uttarkar et al. 2026), while panel (B) shows the burst rate measured with FAST. The Parkes intervals B4 and B5 and the FAST intervals Seg1 and Seg2 indicate the time ranges used for the lensing analysis. B4 and Seg2, which cover approximately the same epoch, are highlighted in red for comparison. The blue dashed curves show the Gaussian lens fits to the burst-rate evolution, and the red vertical lines mark the fitted centers of the corresponding attenuation troughs. Despite the temporal overlap between B4 and Seg2, the fitted trough centers are not aligned between the observations at different frequencies. No artificial bounds were imposed on the lens-model parameters during fitting, allowing both overdense and underdense lens solutions to be explored.
Other Images in This Article
Copyright and Terms & Conditions
© 2026. The Author(s). Published by the American Astronomical Society.

