

Image Details
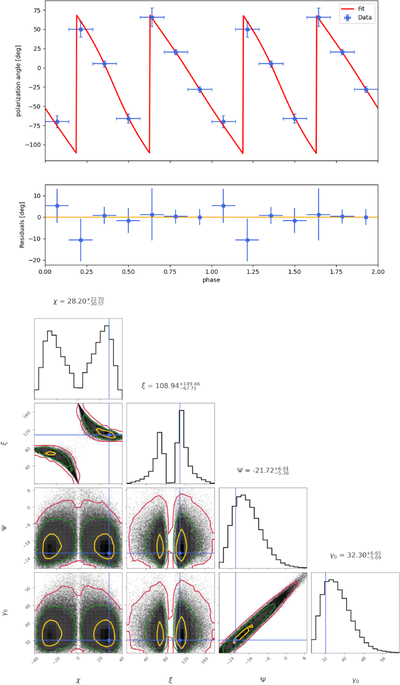
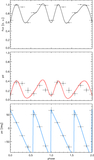
Caption: Figure 8.
Top: IXPE 2.0–7.5 keV polarization angle (blue points with error bars) fitted with the RVM model (see Equation (1)) (red solid line). The errors at 1σ have been reported also for the phase bins where PD falls below MDP99 (see text for more details). Bottom: marginalized posterior distribution in the region around the best-fitting solution. The yellow, green, and red contours show the 1σ, 2σ, and 3σ confidence regions, respectively, while the blue solid lines mark the best-fit values obtained by minimizing the χ2. The (joint) maximum a posteriori estimates are reported above each likelihood histogram.
Other Images in This Article
Copyright and Terms & Conditions
© 2026. The Author(s). Published by the American Astronomical Society.

