

Image Details
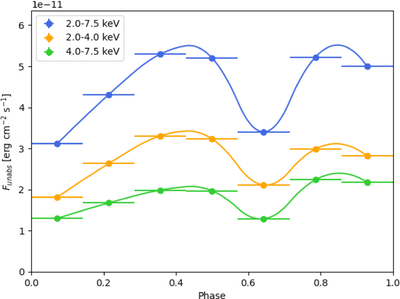
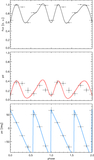
Caption: Figure 2.
Pulse profile of EP J223759.5+531421 from the IXPE-EP joint analysis in the 2.0–7.5 keV (cyan), 2.0–4.0 keV (orange), and 4.0–7.5 keV (green) energy bands. The error bars, at 1σ confidence level (see Table 2), lie inside the symbols. The curves are splines connecting the data for a better visualization.
Other Images in This Article
Copyright and Terms & Conditions
© 2026. The Author(s). Published by the American Astronomical Society.

Copyright ©
2026 Astronomy Image Explorer. All Rights Reserved.
