

Image Details
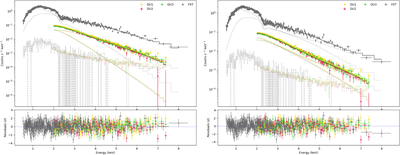
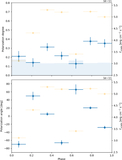
Caption: Figure 1.
Phase-integrated count spectra (dots with 1σ error bars) collected by IXPE DU 1 (yellow), 2 (red), and 3 (green), and by EP-FXT (gray), fitted with a two-blackbody model (left panel) and a blackbody+PL model (right panel). The background for each detector and the single model components are also shown by dashed and dotted histograms, respectively. Fit residuals for the two fits are also reported in the bottom panels. The best-fit parameters are listed in Table 1.
Other Images in This Article
Copyright and Terms & Conditions
© 2026. The Author(s). Published by the American Astronomical Society.

Copyright ©
2026 Astronomy Image Explorer. All Rights Reserved.
