

Image Details
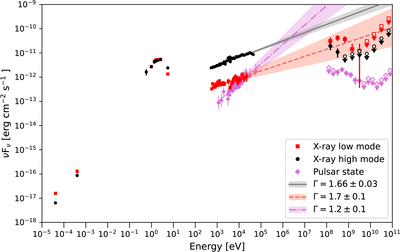
Caption: Figure 4.
The broadband SED of J1023. Black points show X-ray high-mode data, red points show X-ray low-mode data, and magenta points show the pulsar state data. The lines and shaded areas show power-law fits to the X-ray data and corresponding 1σ uncertainties on the photon index.
Other Images in This Article
Copyright and Terms & Conditions
© 2026. The Author(s). Published by the American Astronomical Society.

Copyright ©
2026 Astronomy Image Explorer. All Rights Reserved.
