

Image Details
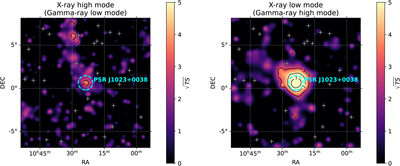
Caption: Figure 3.
Test statistics maps of the region of interest with J1023 removed from the models for X-ray high mode (left) and X-ray low mode (right). The map is produced by adding a test source modeled with a simple power-law spectral model with a photon index fixed at Γ = 2. Dashed cyan circles show the location of J1023. White crosses correspond to the locations of the modeled sources.
Other Images in This Article
Copyright and Terms & Conditions
© 2026. The Author(s). Published by the American Astronomical Society.

Copyright ©
2026 Astronomy Image Explorer. All Rights Reserved.
