

Image Details
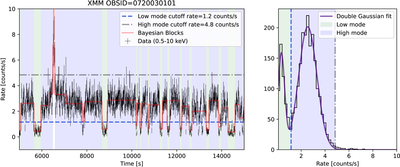
Caption: Figure 1.
Illustrative example of one XMM-Newton observation, where we identify high- and low-mode intervals. Left: a segment of a light curve where J1023 switches between low and high modes, with a flaring episode. Black data points show the EPIC-pn (0.5–10 keV) light curve, and the red line is a Bayesian block representation of the light curve. Right: count-rate histogram of the observation and double Gaussian fit. Blue dashed and gray dashed–dotted lines are the thresholds separating low–high and high–flaring states, respectively, defined in Section 2.1. Green and blue regions show identified low and high mode time intervals.
Other Images in This Article
Copyright and Terms & Conditions
© 2026. The Author(s). Published by the American Astronomical Society.

