

Image Details
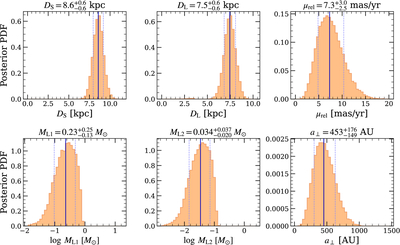
Caption: Figure 3.
Posterior probability distributions of the lens and source physical parameters from the Bayesian analysis. The panels, from top to bottom and left to right, are the source distance DS, lens distance DL, lens-source relative proper motion μrel, the mass of the first and second lens ML1 and ML2, and their projected separation a⊥. The median and ±1σ values are marked in solid black and dashed blue vertical lines and are labeled on the top of each panel.
Other Images in This Article
Copyright and Terms & Conditions
© 2026. The Author(s). Published by the American Astronomical Society.

Copyright ©
2026 Astronomy Image Explorer. All Rights Reserved.
