

Image Details
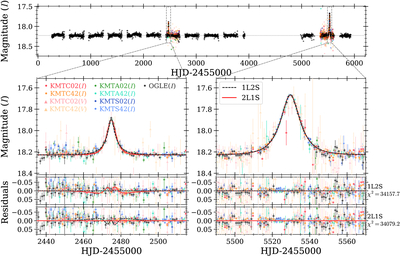
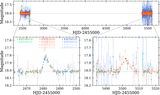
Caption: Figure 1.
Light curve of the microlensing event OGLE-2016-BLG-0523, showing the 1L2S model (dashed magenta line) and the 2L1S model (solid black line). Different datasets are shown with distinct colors and markers, and data are binned daily for clarity. The upper panel displays the full light curve from 2010 to 2025, while the lower panels zoom in on the two events in 2016 and 2024 with their residuals. In each residual panel, we show both the residuals relative to that model and the difference between the 2L1S and 1L2S models for comparison. The baseline magnitude, I = 18.226 mag, is derived from the CFHT images with a point-spread function of ∼0﹩\mathop{.}\limits^{{\unicode{x02033}}}﹩50.
Other Images in This Article
Copyright and Terms & Conditions
© 2026. The Author(s). Published by the American Astronomical Society.

