

Image Details
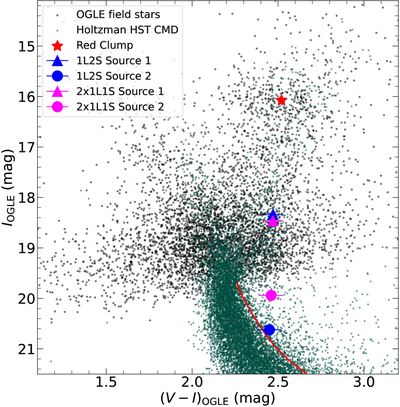
Caption: Figure 2.
Color–magnitude diagram for OGLE-2016-BLG-0523. Black dots show OGLE-III field stars (M. K. Szymański et al. 2011) within ﹩1\mathop{.}\limits^{{\rm{^{\prime} }}}5﹩ of the event position. The red asterisk marks the red-clump centroid. The blue dot and triangle indicate the primary and secondary sources of the 1L2S model, respectively, while the magenta dot and triangle indicate the corresponding sources of the 2×1L1S model. Green points show the Hubble Space Telescope (HST) CMD from J. A. Holtzman et al. (1998), with the HST red-clump centroid shifted to match the OGLE-III red clump. The red line represents the red boundary of bulge main-sequence stars derived from stellar isochrones with [M/H] = +0.5 and an age of 5 Gyr. The secondary source is about 0.6σ redder than this boundary.
Other Images in This Article
Copyright and Terms & Conditions
© 2026. The Author(s). Published by the American Astronomical Society.

