

Image Details
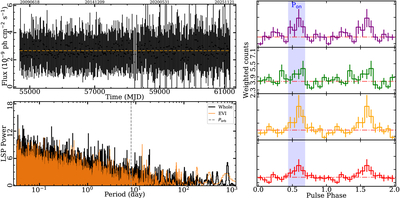
Caption: Figure 4.
Temporal properties of PSR J0435+3233. Upper-left panel: 20 day AP light curve over the whole data span. The horizontal line indicates the best-fit constant count rate. Lower-left panel: LSPs calculated from the 500 s binned AP light curves for the whole data span and the EVI, shown as the black and orange histograms, respectively. The gray dashed line marks the Porb reported by Q. Wu et al. (2026). Right panel: weighted γ-ray pulse profiles constructed from the four time intervals within the EVI. The profiles are shown in chronological order in red, orange, green, and purple, respectively, with the colors corresponding to the four shaded intervals in Figure 1. The vertical blue shaded region marks the on-pulse region shown in Figure 1. Horizontal lines indicate the estimated background levels for the respective intervals. All four profiles are plotted over the same y-axis range to facilitate a direct comparison.
Other Images in This Article
Copyright and Terms & Conditions
© 2026. The Author(s). Published by the American Astronomical Society.

