

Image Details
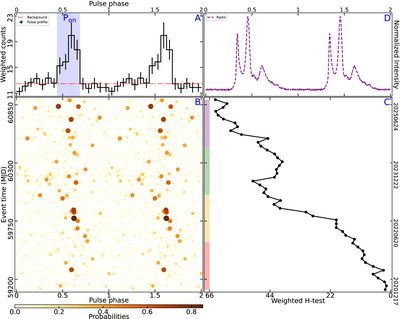
Caption: Figure 1.
Timing analysis of target over the EVI. (A) Integrated weighted γ-ray pulse profile. The horizontal dashed line indicates the estimated background level and the blue shaded regions mark the on-pulse phase region. (B) Phase–time distribution of LAT photons collected within the EVI. Each point represents one photon, and its color and size indicate the probability from the target, with the maximum probability of ∼0.85. (C) Cumulative weighted H-test statistic calculated cumulatively over the EVI. The four color shaded regions indicate the four time intervals mentioned in Section 2.4. (D) Schematic radio pulse profile reconstructed from that reported by Q. Wu et al. (2026) for qualitative comparison. Two rotational cycles are shown in panels (A), (B), and (D) for clarity.
Other Images in This Article
Copyright and Terms & Conditions
© 2026. The Author(s). Published by the American Astronomical Society.

