

Image Details
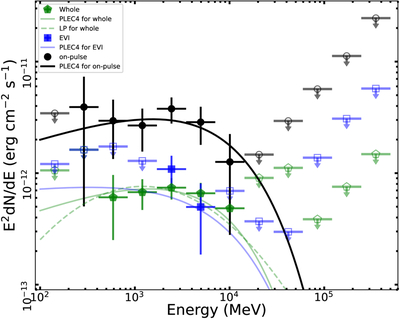
Caption: Figure 2.
0.1–500.0 GeV SEDs obtained from the whole data span, the EVI, and the on-pulse selection within the EVI, shown in green, blue, and black, respectively. The best-fit PLEC4 and LP models are represented by the solid and dashed curves, respectively. Flux measurements are shown for energy bins with TS ≥ 4, whereas 95% upper limits are given for bins with TS < 4.
Other Images in This Article
Copyright and Terms & Conditions
© 2026. The Author(s). Published by the American Astronomical Society.

Copyright ©
2026 Astronomy Image Explorer. All Rights Reserved.
