

Image Details
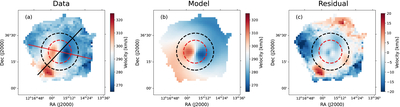
Caption: Figure 3.
3D warped-disk model of H I data. The data, model, and residual are shown in (a), (b), and (c). The color map represents the velocity level. In each panel, the red dashed circle shows the outer boundary of the inner disk, while the black dashed circle shows the inner boundary of the outer disk. The position angles of the inner (77.∘3) and outer (136.∘6) disks are marked by a red line and a black line in panel (a). The red and black dashed circles have radii of ﹩5{.}^{{\prime} }5﹩ and ﹩9{.}^{{\prime} }5﹩, respectively.
Other Images in This Article
Copyright and Terms & Conditions
© 2026. The Author(s). Published by the American Astronomical Society.

Copyright ©
2026 Astronomy Image Explorer. All Rights Reserved.
