

Image Details
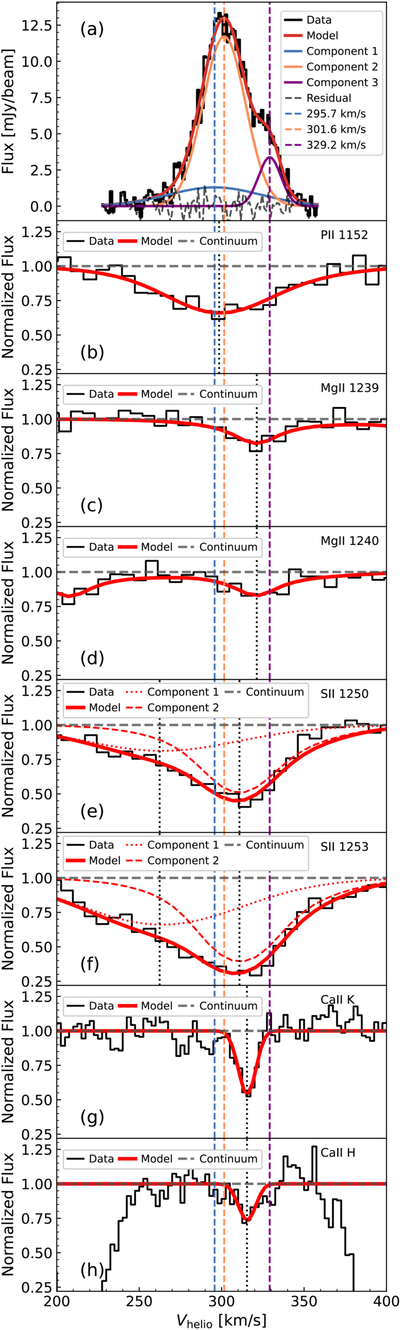
Caption: Figure 2.
(a) VLA H I spectrum of the central region with COS observations. The data and the fitted model are shown as black histograms and red lines, respectively. The residuals are represented using a gray dashed line. The blue, orange, and purple dashed lines in each panel indicate three different H I components at 295.7, 301.6, and 329.2 km s−1, respectively. (b)–(h) Normalized absorption-line profile of NGC 4214. We plot the observed spectrum using a black histogram and the fitted model using a red solid line in each panel. The gray dashed line in each panel is the continuum. The line center is marked using a black dotted line in each panel. For S II λ1250 and λ1253, the two components are represented by red dotted and dashed curves, respectively. The Ca II spectra are fitted only in the ranges 272.6–362.6 km s−1 for K and 287.6–347.6 km s−1 for H on the zero-point-corrected heliocentric velocity scale.
Other Images in This Article
Copyright and Terms & Conditions
© 2026. The Author(s). Published by the American Astronomical Society.

