

Image Details
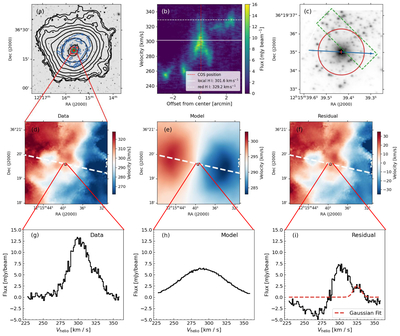
Caption: Figure 1.
(a) H I column density map of NGC 4214 from the FAST observation shown as black contours overlaid on the DESI r-band image (DESI Collaboration et al. 2026). The black contours correspond to a column density from 1017 cm−2 to 1021 cm−2. The blue contours represent the H I column density map of the VLA data from THINGS. The column density is 1019 cm−2, 1020 cm−2, 1021 cm−2, and 1022 cm−2. The COS line of sight is shown by a red cross in each panel. The green circle marks the HIRES line of sight. The central disk region is shown in a red square, whose size is ﹩3\mathop{.}\limits^{{\prime} }38\times 3\mathop{.}\limits^{{\prime} }38﹩. (b) The position–velocity diagram along the major axis (white dashed line in panels (d)–(f)). The red dashed line marks the position of the COS sightline. The white solid and dashed lines mark the local and redshifted H I velocity, respectively. (c) The HST/ACS-F125LP UV image overlaid with the COS PSA (red circle). The blue arrow shows the direction of increasing wavelength along the COS dispersion axis. The green rectangle represents the 1.148″ × 3.5″ slit at a position angle of 45∘ of HIRES. The green rectangle shows the nominal, header-derived HIRES slit position without any artificial displacement. Its absolute registration relative to the HST image remains uncertain, and subarcsecond offsets are not discernible at the scale of panel (a). (d) The velocity map from VLA–THINGS data in the zoom-in region. The black circle represents the beam size of VLA (6″). (e) The rotating-disk model fitted by 3dBbarolo. (f) The residual of the rotating-disk model. (g)–(i) The extracted H I spectrum in the COS line of sight. The red dashed line in panel (i) shows the redshifted Gaussian component.
Other Images in This Article
Copyright and Terms & Conditions
© 2026. The Author(s). Published by the American Astronomical Society.

