

Image Details
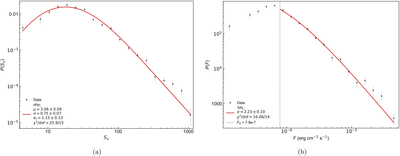
Caption: Figure 5.
Distributions of the ERS and energy flux of MXFs. (a) Probability distribution of the phenomenological ERS proxy. Black points show Sγ evaluated at γ = 0.94, and the solid red curve shows the best-fitting right-Pareto lognormal (rPln) model. (b) Probability distribution of the energy flux. Gray points with error bars show the observed distribution, and the red solid curve shows the best-fitting thresholded power-law (TPL) model. The vertical dotted line marks the threshold flux F0 = 7.9 × 10⁻⁷ erg cm−2 s−1. The best-fitting high-flux slope is αF = 2.23 ± 0.10.
Other Images in This Article
Copyright and Terms & Conditions
© 2026. The Author(s). Published by the American Astronomical Society.

Copyright ©
2026 Astronomy Image Explorer. All Rights Reserved.
