

Image Details
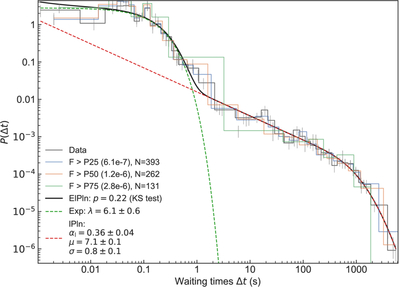
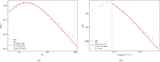
Caption: Figure 2.
Waiting time probability distribution of MXFs from SGR J1935+2154. Black points show the full sample, while colored points correspond to subsamples selected by flux thresholds in units of erg cm−2 s−1. The solid black curve shows the best-fitting ElPln model, consisting of an exponential component (green dashed line) and a left-Pareto lognormal component (red dashed line). The short waiting time regime is dominated by the exponential component, whereas the longer waiting time regime follows a power-law behavior characterized by a power-law slope P(Δt) ∝ Δt−0.64.
Other Images in This Article
Copyright and Terms & Conditions
© 2026. The Author(s). Published by the American Astronomical Society.

Copyright ©
2026 Astronomy Image Explorer. All Rights Reserved.
