

Image Details
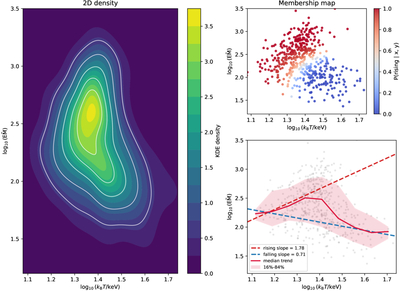
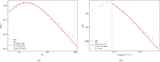
Caption: Figure 3.
Distribution of the emission measure proxy ﹩\tilde{{\rm{EM}}}﹩ as a function of temperature for MXFs statistically favoring the OTTB spectral model. Left: two-dimensional kernel-density estimate in the ﹩{\mathrm{log}}_{10}({k}_{{\rm{B}}}T)﹩–﹩{\mathrm{log}}_{10}\tilde{{\rm{EM}}}﹩ plane. Upper right: probabilistic membership map, where the color indicates the posterior probability that an event belongs to the rising branch, P(rising∣x, y). Lower right: empirical binned median trend (solid red line) and the corresponding 16%–84% percentile range of the data (shaded region), together with the best-fitting rising and falling branches from the two-component mixture model (dashed lines).
Other Images in This Article
Copyright and Terms & Conditions
© 2026. The Author(s). Published by the American Astronomical Society.

