

Image Details
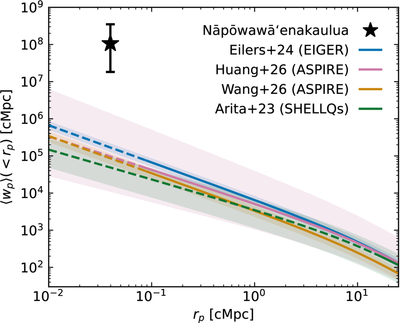
Caption: Figure 4.
Projected quasar autocorrelation function 〈wp〉( < rp) as a function of the projected radius rp. The solid blue, pink, orange, and green lines represent the power-law fit from A.-C. Eilers et al. (2024), J. Huang et al. (2026b), F. Wang et al. (2026), J. Arita et al. (2023), respectively, with the dashed lines being extrapolations. The black star indicates the clustering amplitude measured for Nāpōwawā‘enakaulua.
Other Images in This Article
Copyright and Terms & Conditions
© 2026. The Author(s). Published by the American Astronomical Society.

Copyright ©
2026 Astronomy Image Explorer. All Rights Reserved.
