

Image Details
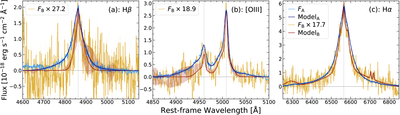
Caption: Figure 3.
Comparison of the Hβ, [O III], and Hα emission line profiles of Nāpōwawā‘enakaulua, after subtracting the best-fit continuum (power law + Fe II template) from both the data and the model, with the shaded regions showing the 1σ uncertainty. (a) Hβ profile, obtained by additionally subtracting all [O III] (and He I, for “A”) model components. (b) [O III]λλ4959, 5007 Å doublet, obtained by additionally subtracting all Hβ model components. (c) Hα + [N II] blend. In each panel, data and best-fit model of “B” are rescaled by a multiplicative factor (quoted in the legend), so that the peak of its best-fit model matches the peak of “A” within the line of interest, allowing a direct comparison of the line profiles, despite “B” being much fainter than “A”. Vertical dotted lines mark the rest-frame wavelengths of the relevant transitions.
Other Images in This Article
Copyright and Terms & Conditions
© 2026. The Author(s). Published by the American Astronomical Society.

