

Image Details
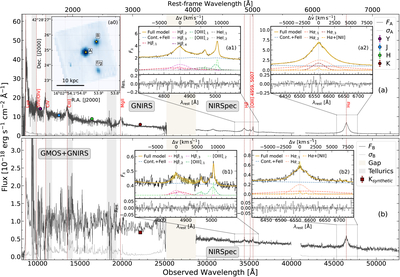
Caption: Figure 2.
(a0) JWST/NIRSpec IFU FoV (white light image), with the two quasars indicated by “A” and “B”, marked by yellow stars, and a candidate foreground galaxy (“f/g”) for which we do not identify any clear emission line. (a) Combined Gemini/GNIRS and JWST/NIRSpec spectrum of Nāpōwawā‘enakaulua “A” (black) and associated error (gray). The light orange band highlights the gap between the spectra ([25241, 28697] Å). The light gray bands indicate the regions affected by telluric absorption ([13500, 14150] and [18200, 19300] Å). We include archival YJHK magnitudes (colored dots; N. P. Ross & N. J. G. Cross 2020) and label the main emission lines (red dashed lines). (a1) Zoom-in on the Hβ + [O III] emission line complex for “A”. Best-fit profiles are overlaid, and residuals are shown in the bottom panel. (a2) Same as (a1), but focusing on the Hα emission line. (b, b1, b2) Same as in (a), but for the combined GMOS+GNIRS and NIRSpec spectrum of “B”. The synthetic K-band magnitude is marked by a red square and derived from the original GNIRS spectrum.
Other Images in This Article
Copyright and Terms & Conditions
© 2026. The Author(s). Published by the American Astronomical Society.

