

Image Details
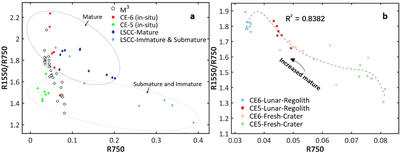
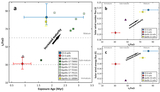
Caption: Figure B2.
The spectral slope of R1550/R750 versus R750. (a) R750 versus R1550/R750 of all data. Furthermore, the spectra of the returned Apollo lunar samples were sourced from the LSCC database, and the maturity data for the LSCC samples were obtained from L. A. Taylor et al. (2010). (b) R750 versus R1550/R750 of M3 from (a). The black arrow indicates the direction of increasing maturity, while the gray dashed line represents the spectral alterations trendline fitted using a sixth-order polynomial.
Other Images in This Article
Show More
Copyright and Terms & Conditions
© 2026. The Author(s). Published by the American Astronomical Society.

Copyright ©
2026 Astronomy Image Explorer. All Rights Reserved.
