

Image Details
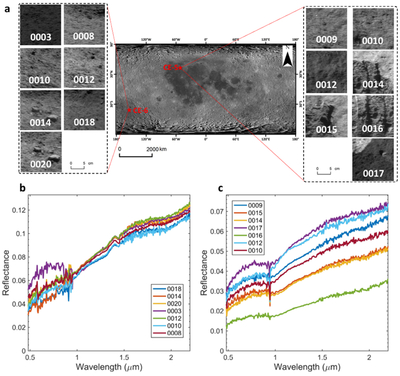
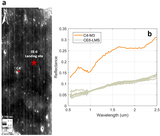
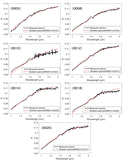
Caption: Figure 1.
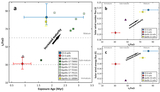
The remote sensing images and in situ spectral data at the CE5 and CE6 landing sites. (a) The 750 nm band images obtained by CE6-LMS and CE5-LMS. The background image is the Lunar Reconnaissance Orbiter Camera (LROC) WAC image. (b) In situ measured LMS full-range spectra on the lunar regolith at different sites of the CE6 landing site (The sequence from top to bottom corresponds to increasing distance from the lander, and this arrangement is similarly applicable to Figure 1(c)), which includes the sampling site before sampling (0003, the earliest in situ measurement data). (c) In situ full-range spectra of CE5-LMS were derived from J. Liu et al. (2022), which include the before-sampling surface (0009, 0010, 0012 and 0017), and the postsampling surface (0014, 0015 and 0016). The LMS-ID information is in Table A1.
Other Images in This Article
Show More
Copyright and Terms & Conditions
© 2026. The Author(s). Published by the American Astronomical Society.

