

Image Details
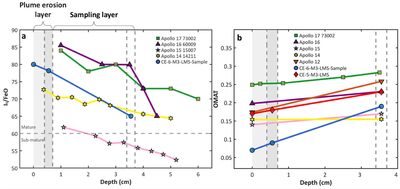
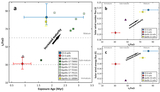
Caption: Figure 4.
The variations of regolith maturity along with depth. (a) The variation trends of regolith maturity (Is/FeO) with regolith depth. 73,002 is an Apollo 17 core sample (R. Morris et al. 2022), 60,009 is an Apollo 16 core sample (R. Morris 1978a), 15,007 is an Apollo 15 core sample, and 14,211 is an Apollo 14 core sample from the Lunar Sample Compendium. Furthermore, the two gray dashed lines on the left represent rocket plume erosion depths of 0.4 cm and 0.7 cm, respectively. The two gray dashed lines on the right represent sampling depths of 3.4 cm and 3.7 cm. (b) Overall trend of maturity (OMAT) changes in the shallow regolith. The Apollo data (12, 14, 15, 16) used the OMAT map from MI (representing the natural top surface regolith) and average maturities from LSCC (representing the regolith maturity after sampling). 73,002 is an Apollo 17 sample (L. Sun et al. 2021). Respectively, the maturity index Is/FeO and the OMAT values for CE6 are derived from M3 (before landing), in situ spectra (before sampling, after rocket plume erosion), and laboratory sample spectra (after sampling), representing postsampling conditions (blue dot and line data). Our study of "remote sensing orbiter spectra–in situ spectra–sample spectra" is similar to previous research schemes on the nearside of the Moon (Y. Wu et al. 2019, 2024). OMAT values for CE5 are derived from M3 and LMS (before sampling and postsampling), respectively (red dot and line). The gray dashed lines in this figure correspond to the depth values shown in (a).
Other Images in This Article
Show More
Copyright and Terms & Conditions
© 2026. The Author(s). Published by the American Astronomical Society.

