

Image Details
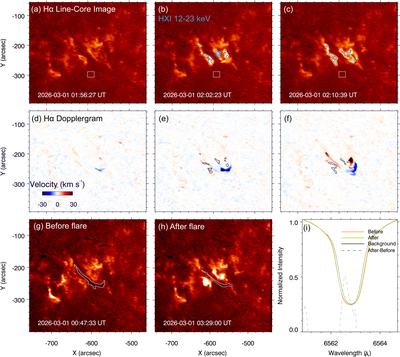
Caption: Figure 4.
CHASE/HIS observations of the flare. (a)–(c) Hα line-core images showing the evolution of the flare. The black contours indicate the locations of the flare ribbons. The blue curves denote the 10%, 40%, and 80% levels of the maximum of the reconstructed HXR sources in the 12–23 keV energy band. The white rectangles mark the background regions used to define the reference zero-shift spectral profile. (d)–(f) Chromospheric dopplergrams of the flare, with positive values representing redshifts and negative values representing blueshifts. The black contours outline the same flare ribbons as in panels (b)–(c). (g)–(h) CHASE/HIS Hα line-core images just before and after the flare. The white solid lines trace the filament identified from the spectral line. (i) Comparison of the averaged spectral line profiles of the filament before (orange line) and after (green line) the flare. The black solid line represents the averaged line profile of the background region. The gray dashed line shows the difference between the line profiles after and before the flare. A 2 s animation is available, which includes the Hα line-core images and dopplergrams.
(An animation of this figure is available in the online article.)
(An animation of this figure is available.)
The video/animation of this figure is available in the online journal.
Other Images in This Article
Copyright and Terms & Conditions
© 2026. The Author(s). Published by the American Astronomical Society.

