

Image Details
Caption: Figure 1.
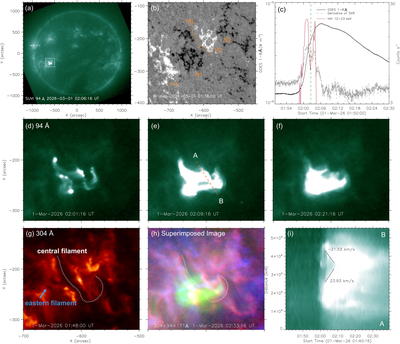
Overview and EUV evolution of the C6.1 flare on 2026 March 1. (a) FY-4C/SUVI 94 Å full-disk image at 02:06:16 UT. The white rectangle marks the region of interest encompassing the flare and AR 14380. (b) Photospheric radial magnetic field map inferred from the SDO/HMI vector magnetogram prior to flare onset at 01:36 UT. The orange curve denotes the central PIL of the active region. (c) Soft X-ray (SXR) and hard X-ray (HXR) light curves during the C6.1 flare. The black solid line represents the SXR flux, with the gray dashed line showing its time derivative. The red solid line indicates the evolution of the 12–23 keV HXR count rate observed by ASO-S/HXI. The green vertical dashed line marks the onset of the ejection of the small filament east of the central filament. (d)–(f) FY-4C/SUVI 94 Å images at three times. The orange dashed line marks the slice for the time–distance diagram. (g) SUVI 304 Å image at 01:48 UT, before the onset of the flare. (h) Composite image of the three SUVI EUV channels at 02:33 UT. The white dotted lines in (g) and (h) indicate the filament spine measured from the 304 Å image at 01:48 UT. (i) Time–distance diagram acquired from the SUVI 94 Å observations. A 5 s online animation depicting the evolution of the flare in SUVI EUV observations is presented.
(An animation of this figure is available in the online article.)
(An animation of this figure is available.)
The video/animation of this figure is available in the online journal.
Other Images in This Article
Copyright and Terms & Conditions
© 2026. The Author(s). Published by the American Astronomical Society.

