

Image Details
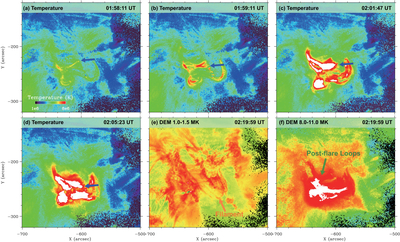
Caption: Figure 3.
Computed DEM results. (a)–(d) Temporal evolution of the DEM-weighted temperature distribution. The dark blue arrows point to the drifting end of the northern heated loops. (e)–(f) DEM images at 02:19:59 UT showing the coronal plasma in the temperature ranges of 1.0–1.5 MK and 8.0–11.0 MK, respectively.
Other Images in This Article
Copyright and Terms & Conditions
© 2026. The Author(s). Published by the American Astronomical Society.

Copyright ©
2026 Astronomy Image Explorer. All Rights Reserved.
